

I first started rock climbing in graduate school with some friends, and quickly grew to love it. The combination of athleticism and the extreme focus needed when you’re on the wall really appealed to me, plus the community is very friendly and welcoming. I’ve stuck with it since, and it is now my main hobby, form of exercise, and place where I see my friends.
A couple of years ago Reddit user higiff created a survey for the climbharder subreddit, which as the name suggestions, is all about training for rock climbing. In the nearly 3 years since, the survey has been completed 473 (!) times. It asks about climbing ability, various questions about body morphology, strength, and training regimen. There have been some analyses done of the data (you can also find the link to the survey results at that link), but I found I still had some unanswered questions. So here is my analysis of ‘what correlates with how well someone climbs?’.
A side note, a recurring theme will be that this is a purely correlational analysis, so while some effects may truly be causal (e.g. years of experience is probably causal), others may not be. I would not recommend building your own training solely around these results.
The full code for these analyses and cleaned-up copy of the survey responses is available HERE. I am not going to go through all the code, because that would be boring.
What is climbing ability?
In the survey, respondents were asked 6 questions about how well they climb. Three are about bouldering, and three are about roped climbing. No distinction is made between indoor vs outdoor, or top-rope vs sport vs trad. For the uninitiated, each climbing route is assigned a difficulty level, and the difficulty is supposed to increase roughly linearly as the level increases. For each style respondents were asked about (1) the max difficulty ever completed, (2) the max difficulty they’ve completed in the past 3 months, and (3) the difficulty level they can send (finish without falling) 90% of the time. For the purposes of these analyses, I’m going to say that climbing ability is how hard you’re able to climb.
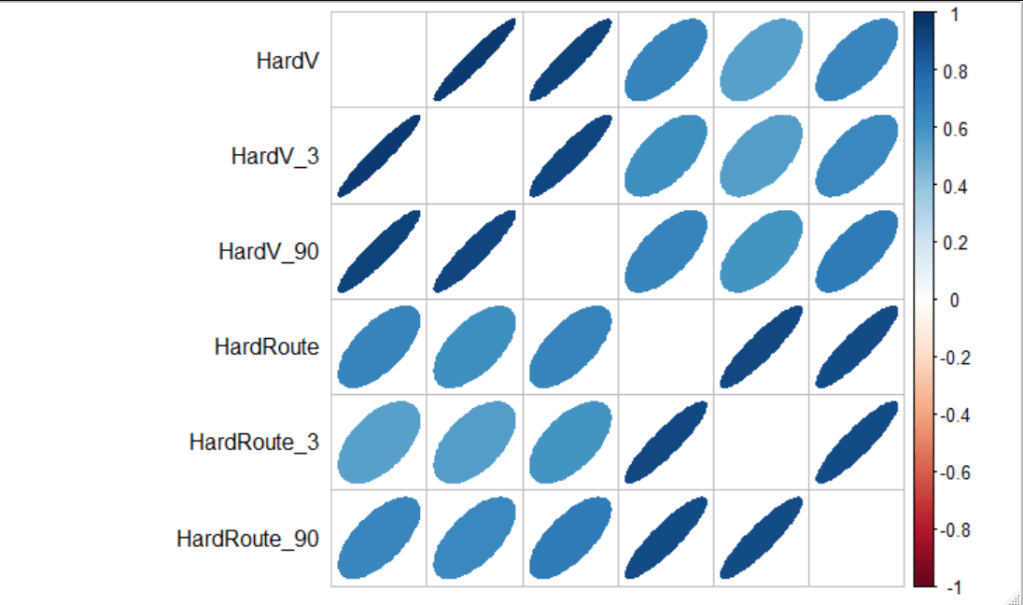
Looking at the correlation matrix, we see that all the bouldering measures are correlated with one another, and the roped measures are similarly inter-correlated. The two styles are also pretty correlated – rs = 0.5 – 0.7.
I combined these 6 questions via a confirmatory factor analysis (CFA), extracting a single factor. A one-factor CFA says ‘yes, each of these things are different, but also they overlap and are correlated. So I’m going to say that the thing I care about, climbing ability, is the thing that drives how well you do across all these measures’. This approach is widely used in psychology, where for instance ‘intelligence’ is the thing that drives how well you perform across a range of cognitive tests.
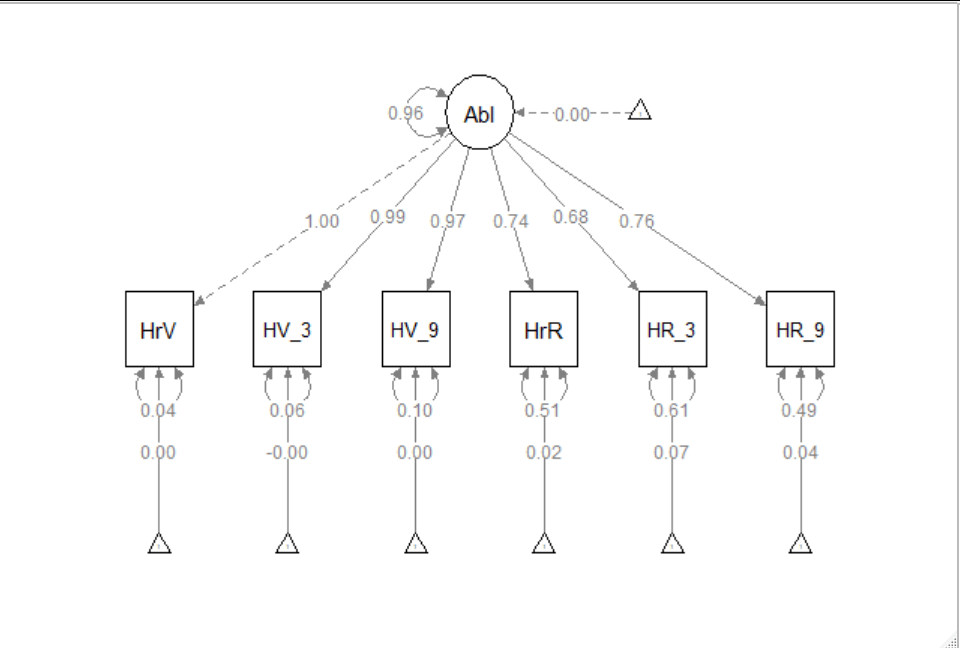
The single factor fits moderately well (CFI=0.736). A two-factor model would fit better, but I’m not interested in contrasting bouldering and route climbing. We see that ‘HrV’, which is ‘What’s the hardest boulder you’ve ever done?’, loads most strongly on the climbing ability factor. And in general the bouldering questions load more strongly than the route questions. This is probably because the bouldering questions are more strongly inter-correlated than the route questions, so bouldering dominates the factor (see the correlation plot above).
Looking at correlations between the climbing ability and bouldering (left), the strong correlation between the two is clear, but it’s also clear that there is variability in ability for each bouldering level. The correlation between ability and route climbing (right) is largely quite linear, though with more spread, except for the handful of outliers who reported poor route climbing, but are actually pretty decent at bouldering, so they’re given a higher ability score.

Physical attributes that correlate with climbing ability
Ok, now that we have a measure of climbing ability, we can see what correlates with it. Things I considered included Sex, Height, Arm span, BMI, Ape-index (the ratio of arm span and height), and Strength:Weight ratio. For strength, we have the most data on max pull-ups and max push-ups, so I’m using those numbers as proxies for strength, which is probably not optimal, but it’s what we have. Also, I’ll note that for all analyses, continuous variables (like say Height) were normalized prior to analyses, so that 0=average and the standard deviation=1. That way, the effect sizes from regressions can be interpreted like correlation coefficients, and effects are more comparable across different variables.
The first model tested the correlation of Ability with Sex, BMI, Ape-index, and Height, finding that a higher Ape-index and being Male is correlated with a higher climbing ability. NB that there are only 65 women in this data set (13%).
Call:
lm(formula = ability ~ Sex + Ape + Height + BMI, data = climbharder)

Residuals:
     Min       1Q   Median       3Q      Max
-2.17994 -0.65271 -0.00456  0.63182  2.67139

Coefficients:
            Estimate Std. Error t value Pr(>|t|)
(Intercept) -0.70057    0.14131  -4.958 1.02e-06 ***
SexMale      0.83183    0.15511   5.363 1.33e-07 ***
Ape          0.19101    0.04515   4.231 2.84e-05 ***
Height      -0.07502    0.05396  -1.390   0.1651
BMI         -0.08484    0.04380  -1.937   0.0534 .
---
Signif. codes:  0 ‘***’ 0.001 ‘**’ 0.01 ‘*’ 0.05 ‘.’ 0.1 ‘ ’ 1

Residual standard error: 0.9393 on 438 degrees of freedom
  (30 observations deleted due to missingness)
Multiple R-squared:  0.1223,	Adjusted R-squared:  0.1143
F-statistic: 15.26 on 4 and 438 DF,  p-value: 1.078e-11
I operationalized Strength:Weight as the ratio of max pull-ups and max-pushups to BMI, and then I log-transformed to unskew it, and normalized. Interestingly, the Strength:Weight ratio for pull-ups fully accounts for the effects of Sex. That is, the women in this data set are climbing just as hard as men who have the same Strength:Weight ratio.
Call:
lm(formula = ability ~ Sex + Ape + Strength + StrengthPush, data = climbharder)

Residuals:
     Min       1Q   Median       3Q      Max
-2.38887 -0.59485  0.04937  0.51752  2.56884

Coefficients:
             Estimate Std. Error t value Pr(>|t|)
(Intercept)  -0.25515    0.15151  -1.684   0.0934 .
SexMale       0.23770    0.16615   1.431   0.1538
Ape           0.11054    0.05371   2.058   0.0406 *
StrengthPull  0.53154    0.06594   8.060 3.15e-14 ***
StrengthPush -0.09407    0.06098  -1.543   0.1242
---
Signif. codes:  0 ‘***’ 0.001 ‘**’ 0.01 ‘*’ 0.05 ‘.’ 0.1 ‘ ’ 1

Residual standard error: 0.8331 on 250 degrees of freedom
  (218 observations deleted due to missingness)
Multiple R-squared:  0.3098,	Adjusted R-squared:  0.2987
F-statistic: 28.05 on 4 and 250 DF,  p-value: < 2.2e-16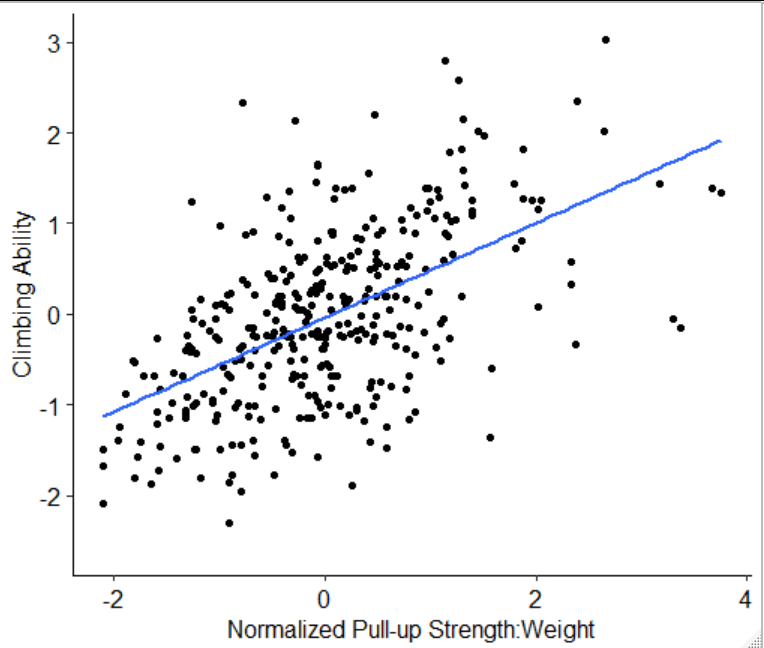
Experience matters
Next, climbing experience and time spend climbing should obviously be important correlates of climbing ability. We have data on how long respondents have been climbing for, how frequently they climb, and how many hours they climb for. We also know whether they only climb indoors, or climb both indoors and outdoors.
We see that years of climbing (unsurprisingly) is very correlated with climbing ability, as is how frequently a person climbs. The estimated number of actual hours spent climbing is not correlated. And finally, better climbers tend to climb both indoors and outdoors (indoor-only climbers are worse). NB that the sample size drops by 100 here (relative to the last analysis), because not everyone completed all these fields, so we’re looking at N=341.
Call:
lm(formula = ability ~ Experience + Frequency + climbtime + Indoor +
    Ape + Strength, data = climbharder)

Residuals:
     Min       1Q   Median       3Q      Max
-2.27584 -0.36380 -0.05186  0.40682  1.87981

Coefficients:
            Estimate Std. Error t value Pr(>|t|)
(Intercept) -2.18245    1.10046  -1.983  0.04816 *
Experience   0.33584    0.03524   9.530  < 2e-16 ***
Frequency    0.25731    0.04543   5.664  3.2e-08 ***
climbtime    0.01223    0.01278   0.957  0.33917
Indoor      -0.28293    0.08572  -3.301  0.00107 **
Ape          2.13607    1.07974   1.978  0.04871 *
StrengthPull 0.34975    0.03687   9.486  < 2e-16 ***
---
Signif. codes:  0 ‘***’ 0.001 ‘**’ 0.01 ‘*’ 0.05 ‘.’ 0.1 ‘ ’ 1

Residual standard error: 0.6196 on 334 degrees of freedom
  (132 observations deleted due to missingness)
Multiple R-squared:  0.5863,	Adjusted R-squared:  0.5789
F-statistic: 78.91 on 6 and 334 DF,  p-value: < 2.2e-16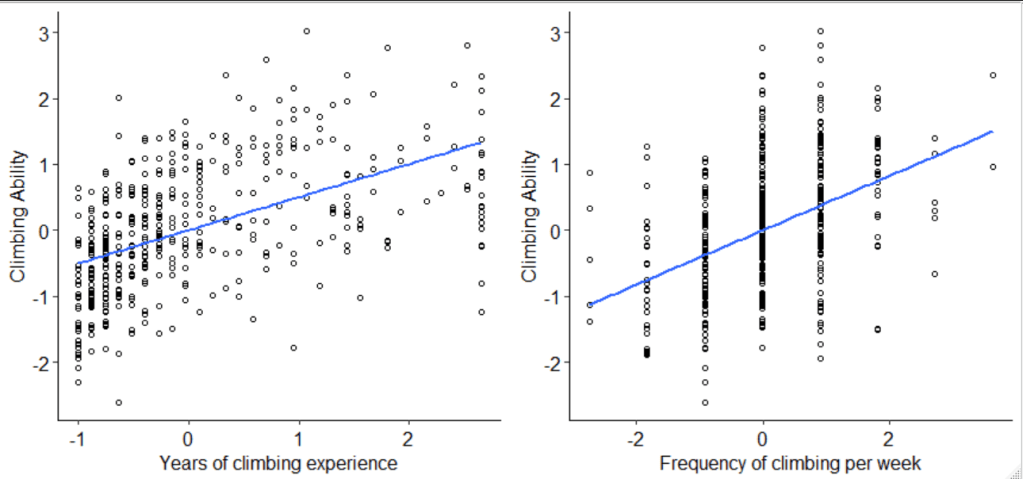
The majority of the respondents have 6 years or less of climbing experience, but we see in that window that average ability increases with every 1/2 year (the unit of the x-axis) they spend climbing. For climbing frequency, better climbers climb more often on average, but very few people climb more than 4x per week.
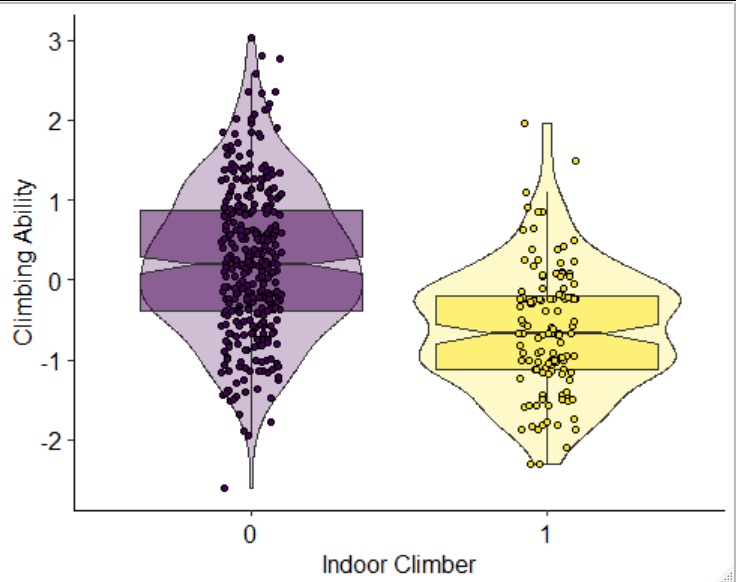
Indoor-only climbers are worse on average that climbers who climb both indoors and outdoors.
Training for climbing
There are various kinds of training for climbing that one might do. The survey asked about hang board, campus board, endurance training, and overall time spent training. Very few people spent more than one hour on the campus board per week, I’ve entered that as a binary variable (yes/no). Hang board, endurance, and overall training time are entered as hours/week.
While overall time spent training is not correlated with climbing ability, training on the campus and hang board both are positively correlated with ability. Surprisingly endurance training is negatively correlated. Looking at the associations in isolation (with no other variables), the effects of campus and hang board training look robust. I don’t really believe the endurance training effect.
Call:
lm(formula = ability ~ Ape + Experience + Strength + Frequency +
    climbtrain + hangboardtime + campusboard + endurancetime,
    data = climbharder)

Residuals:
     Min       1Q   Median       3Q      Max
-1.99807 -0.41303 -0.02409  0.40210  2.02550

Coefficients:
              Estimate Std. Error t value Pr(>|t|)
(Intercept)   -0.05542    0.03998  -1.386  0.16663
Ape            0.06062    0.03423   1.771  0.07751 .
Experience     0.34553    0.03438  10.052  < 2e-16 ***
StrengthPull   0.33103    0.03811   8.687  < 2e-16 ***
Frequency      0.27482    0.03772   7.285 2.35e-12 ***
climbtrain     0.04529    0.03955   1.145  0.25300
hangboardtime  0.09030    0.04075   2.216  0.02739 *
campusboard    0.17071    0.08403   2.032  0.04299 *
endurancetime -0.09520    0.03531  -2.696  0.00737 **
---
Signif. codes:  0 ‘***’ 0.001 ‘**’ 0.01 ‘*’ 0.05 ‘.’ 0.1 ‘ ’ 1

Residual standard error: 0.6169 on 332 degrees of freedom
  (132 observations deleted due to missingness)
Multiple R-squared:  0.5924,	Adjusted R-squared:  0.5826
F-statistic: 60.32 on 8 and 332 DF,  p-value: < 2.2e-16
Other training: Strength, fitness, and sports
We also have data on other training activities that the respondents do. We know whether they strength train, how often, and generally which muscle groups they focus on, and we know whether they do any of: running, bicycling, other cardio, as well as yoga and stretching.
We see that none of the non-climbing training is correlated with a higher climbing ability. In fact, two kinds of training – strength training legs and doing cardio – are correlated with being worse at climbing.
Call:
lm(formula = ability ~ Ape + Experience + Strength + Frequency +
    Indoor + campusboard + hangboardtime + Core + Antagonists +
    UpperPull + UpperPush + Legs + strengthtrain + strengthtrainfreq +
    Cardio + Yoga + Stretching + Running + Hiking + Biking, data = climbharder)

Residuals:
     Min       1Q   Median       3Q      Max
-1.94858 -0.37271 -0.02554  0.39182  1.57141

Coefficients:
                  Estimate Std. Error t value Pr(>|t|)
(Intercept)        0.22285    0.08898   2.505  0.01276 *
Ape                0.04127    0.03413   1.209  0.22747
Experience         0.30563    0.03549   8.612 3.33e-16 ***
StrengthPull       0.29549    0.03772   7.834 7.02e-14 ***
Frequency          0.24815    0.03648   6.802 5.08e-11 ***
Indoor            -0.27285    0.08339  -3.272  0.00119 **
campusboard        0.20690    0.08422   2.457  0.01455 *
hangboardtime      0.07291    0.04069   1.792  0.07408 .
Core              -0.04478    0.11079  -0.404  0.68637
Antagonists        0.07116    0.08028   0.886  0.37604
UpperPull          0.03547    0.09129   0.388  0.69792
UpperPush          0.02632    0.10182   0.259  0.79618
Legs              -0.24152    0.08055  -2.998  0.00293 **
strengthtrain     -0.14153    0.14679  -0.964  0.33570
strengthtrainfreq  0.02350    0.03339   0.704  0.48199
Cardio            -0.24418    0.09653  -2.530  0.01190 *
Yoga              -0.06769    0.09271  -0.730  0.46586
Stretching        -0.16305    0.17276  -0.944  0.34599
Running            0.03479    0.11015   0.316  0.75235
Hiking             0.04659    0.20622   0.226  0.82140
Biking             0.15959    0.12577   1.269  0.20538
---
Signif. codes:  0 ‘***’ 0.001 ‘**’ 0.01 ‘*’ 0.05 ‘.’ 0.1 ‘ ’ 1

Residual standard error: 0.5976 on 320 degrees of freedom
  (132 observations deleted due to missingness)
Multiple R-squared:  0.6313,	Adjusted R-squared:  0.6082
F-statistic: 27.39 on 20 and 320 DF,  p-value: < 2.2e-16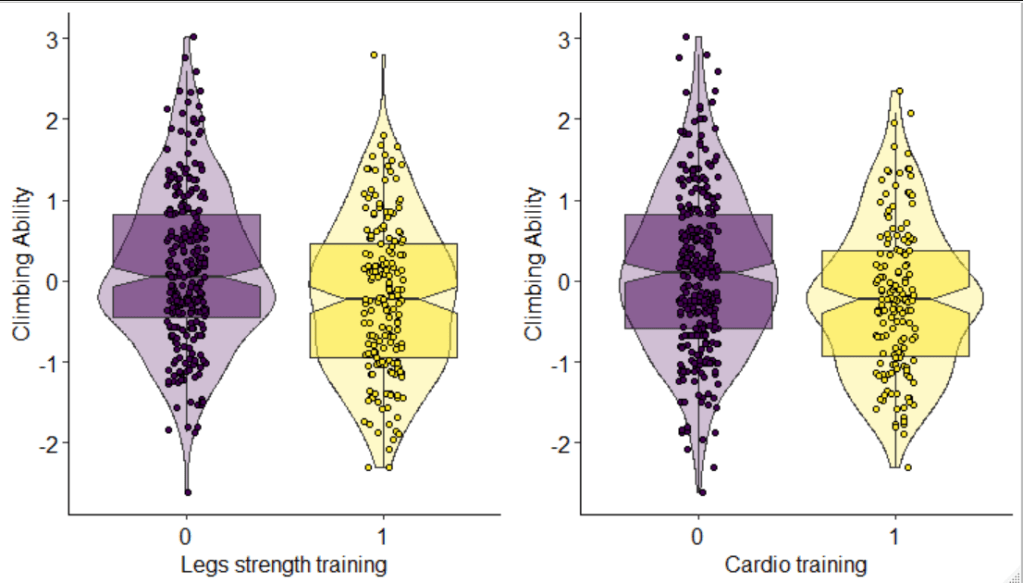
Legs strength training and cardio training are both correlated with having lower climbing ability, on average. However, I hope it’s clear from these plots that these effects are small and that there are many people who do this kind of training and perform very well. My interpretation is that climbers with higher ability are more likely to regard climbing as their primary sport, and thus invest more time into climbing when they can, rather than cross-training.
A final model
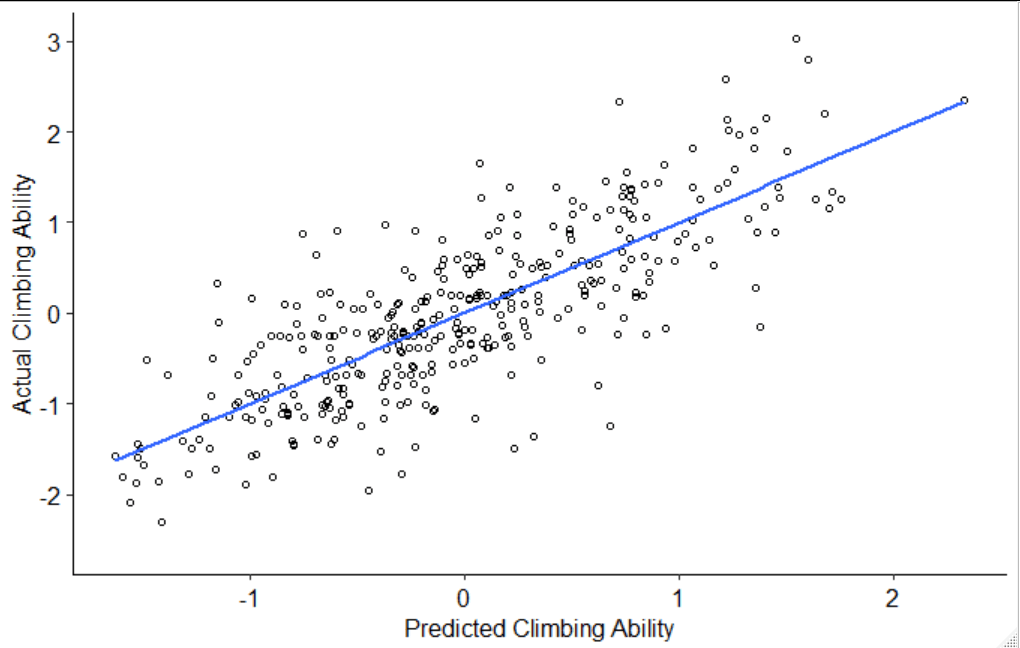
To wrap things up, here’s a final model with the most correlated variables retained. Note that this is an exploratory analysis, so while I think these results are interesting, they are not definitive.
Call:
lm(formula = ability ~ Experience + Strength + Frequency + Indoor +
    campusboard + hangboardtime + Legs + Cardio, data = climbharder)

Residuals:
     Min       1Q   Median       3Q      Max
-1.92479 -0.37333 -0.03316  0.38702  1.62056

Coefficients:
              Estimate Std. Error t value Pr(>|t|)
(Intercept)    0.18679    0.05331   3.504 0.000518 ***
Experience     0.31664    0.03353   9.444  < 2e-16 ***
StrengthPull   0.29801    0.03440   8.663  < 2e-16 ***
Frequency      0.24892    0.03435   7.247  2.7e-12 ***
Indoor        -0.27043    0.07763  -3.483 0.000557 ***
campusboard    0.20222    0.07571   2.671 0.007910 **
hangboardtime  0.07797    0.03585   2.175 0.030320 *
Legs          -0.23515    0.06382  -3.685 0.000265 ***
Cardio        -0.20800    0.06561  -3.170 0.001657 **
---
Signif. codes:  0 ‘***’ 0.001 ‘**’ 0.01 ‘*’ 0.05 ‘.’ 0.1 ‘ ’ 1

Residual standard error: 0.5868 on 353 degrees of freedom
  (111 observations deleted due to missingness)
Multiple R-squared:  0.6255,	Adjusted R-squared:  0.617
F-statistic: 73.71 on 8 and 353 DF,  p-value: < 2.2e-16
If we predict climbing ability from this model, it does a decent job. Notice, however, that many points are still far from the regression line (blue). Someone could be predicted to be an average climber (predicted ability of 0), but in reality they could be below average (score of -1), or way above average (score of 2).
In conclusion…
What correlates with how well someone climbs? In order of importance, good climbers are more likely to:
- Have more experience
- Be strong for their size and weight
- Climb frequently
- Climb outdoors and indoors
- Train using the campus and hang board
- Spend less time training their legs and cardio
This is largely common knowledge, not exactly a break through. I was more interested to learn about things that don’t matter:
- Sex doesn’t determine how good a climber you can be
- Any body (tall or short, big or small) can be good at climbing
- Ape-index probably isn’t important (though it can be fun!)
Is any of this causal? These analyses don’t give any information on that. If I had to guess, I would say that the larger an effect is, the more likely it is to be causal. If you want to get better at climbing, your best bet is to climb more and get stronger. If you currently run or train your legs, I wouldn’t rush to stop. And if you don’t already train on the campus or hang board, starting probably won’t make a huge difference.
Thanks for reading!

Hi David, I came across you analysis here on Medium, and read with interest. I’m interested to grab the data from the survey and play with it myself. My comment/ question is just that in reading, it seemed to me that max pullups and pushups are in themselves good proxy substitutes for strength to weight ratio. Why muck them up with BMI, itself a more practical than quality metric. Did you try your analysis without using the BMI data? Cheers.
LikeLike
Hi! I actually don’t recall anymore whether I did it without BMI. Of course, if I was doing this now I also probably wouldn’t have done it that way! I think you’re probably right that max pullups/pushups is just as good. Thanks for the interest!
LikeLike