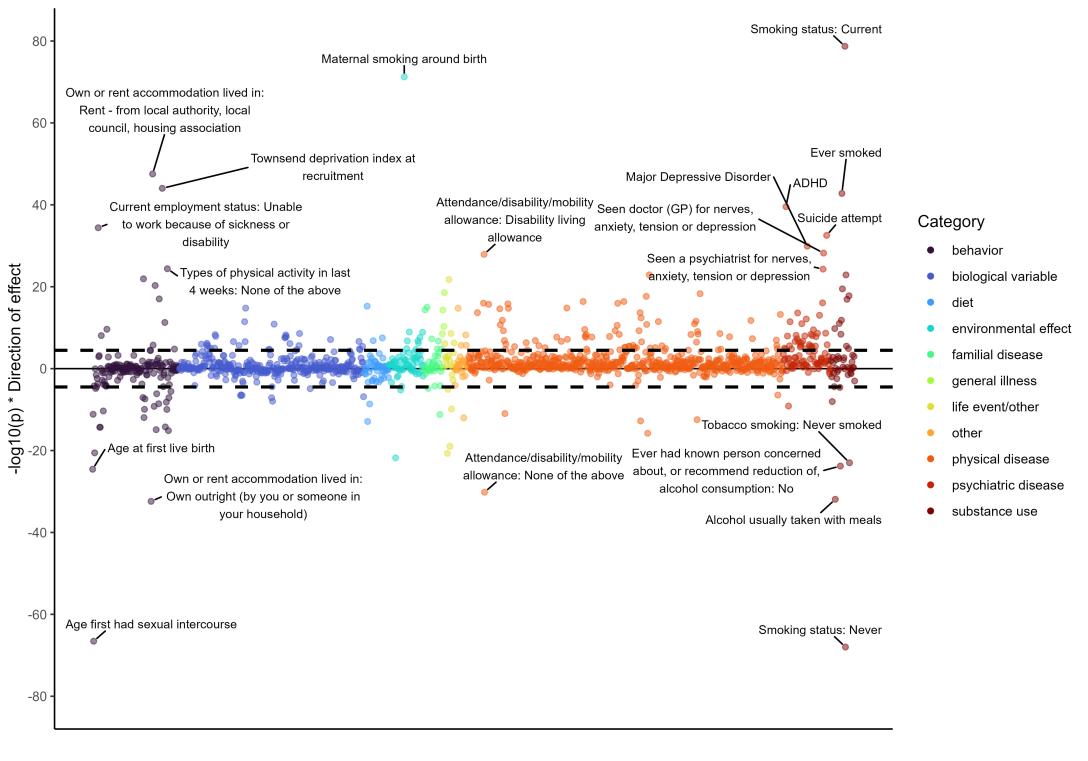
I enjoy making data visualizations. Here are some examples of my work. All were done in R.

Neuroscience, addiction, development, genetics, and statistics
I enjoy making data visualizations. Here are some examples of my work. All were done in R.

This is a short post on how to quickly get started using Turbo with your ggplots.

In this post I use R to show how to make what I’ve been using as an alternative to the standard bar graph - a scatter box violin plot.
